City Snapshots: A Deeper Dive
Long and Unique Histories Across America
This section looks at areas with sizable Asian American populations: New York, Chicago, San Francisco, and Los Angeles county. These areas are home to and growing Asian American communities. They house different Asian ethnic enclaves, originally formed due to anti-Asian laws that segregated Asians to certain areas, but that are now community landmarks where people gather.
Asian American communities in these geographies have experienced a rise in anti-Asian hate with the onset of COVID-19.
Visualizing Acts of Hate and Discrimination
For each area, local hate crime data and data from community trackers show the rise in anti-Asian hate incidents. They also illustrate the significant discrepancy between the number of official hate crimes reported by law enforcement and the number of hate incidents reported to community trackers which include hate incidents that do and do not meet the legal definition of crimes. Stories of hate incidents reported to the community trackers are also provided for context to instances that are not hate crimes, but nevertheless are acts of hate and discrimination.
New York City's AAPI community dates back to the early 1800s. Each of the five boroughs—Bronx, Brooklyn, Manhattan, Queens, and Staten Island—have vibrant and growing AAPI communities.
Below explore the AAPI population by neighborhood tabulation areas in New York City.


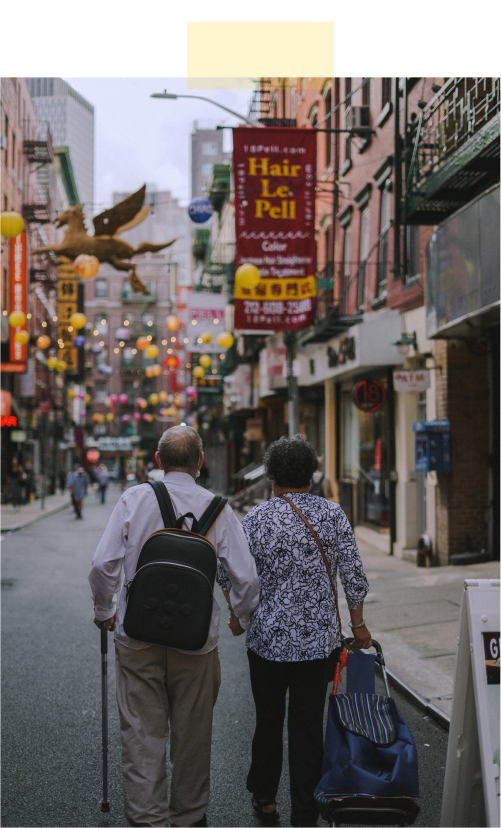
One of the largest Asian American communities in the country
As a city with one of the largest Asian American communities in the country, New York City has unfortunately seen its share of anti-Asian hate.
Data from NYC Open Data shows the New York City Police Department (NYPD) reported 253 hate crimes toward AAPI people between 2017-2022.
Grocery store
New York City, New York
On the street
Brooklyn, New York
San Francisco has been home to a large and growing Asian American community since the 1840s. Explore the AAPI population by San Francisco neighborhoods below.

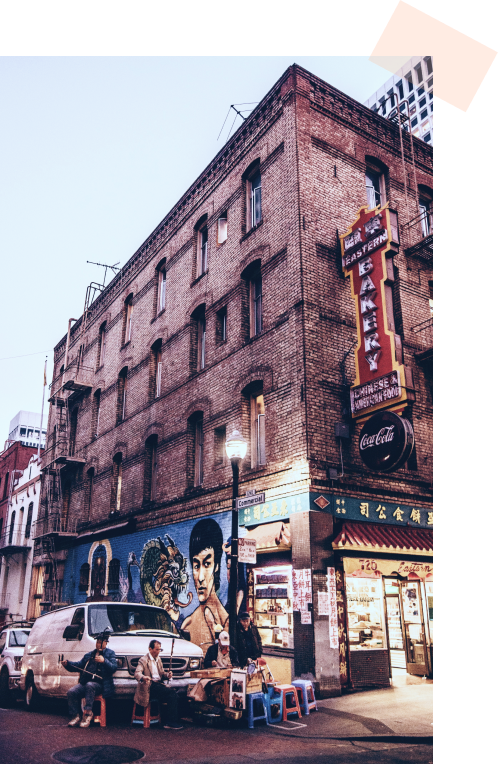

A long history of anti-immigrant sentiment
San Francisco and the Bay Area have a long history of anti-Asian and anti-immigrant sentiment that has persisted prior to and since the COVID-19 pandemic.
San Francisco has the highest number of anti-Asian hate crimes per 100k (22.97) of the four areas examined here. The data are from the San Francisco Police Department’s 2021 Preliminary Hate Crime Statistics.
Richmond District
San Francisco, California
While the first Asians in Chicago arrived in the late 1800s, the large growth in the community came in the 1950s and subsequent decades. Present day, the Asian American population is the fastest growing racial group in Chicago which has contributed to the growth of a more diverse Chicago.
Below looks at the AAPI population by Chicago’s 77 community areas using 2020 census data.
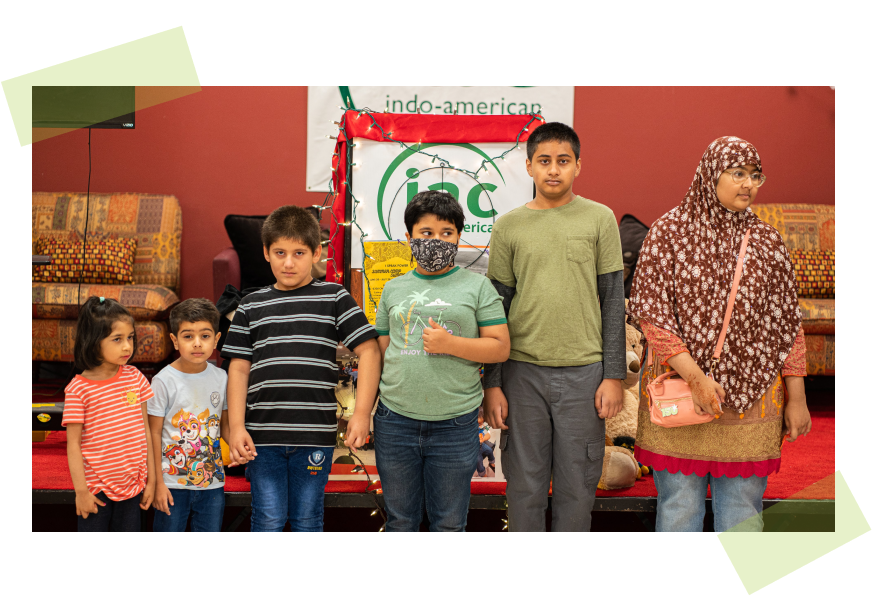

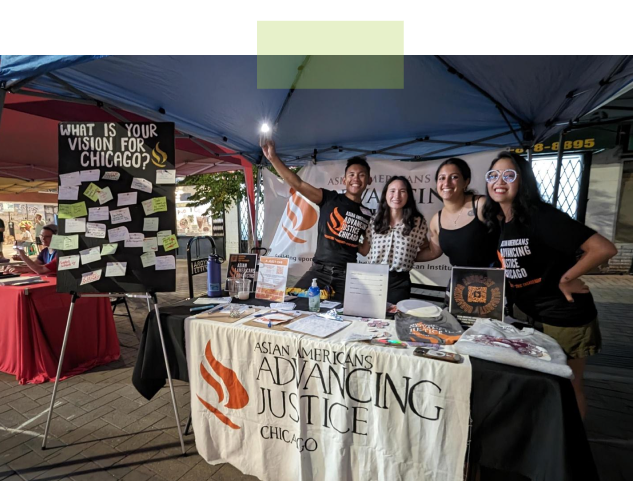
Incomplete picture? Underreporting of hate crimes
Chicago has fewer anti-Asian instances than other areas here, but the data from the Chicago Police Department (OpenData Chicago) still show a significant rise in spite of a relatively smaller, albeit growing, Asian American community.
Business
Chicago, Illinois
On the street
Chicago, Illinois
As the most populous county in California, Los Angeles county is home to the largest AAPI population. It is home to the largest Korean, Japanese, Thai and Cambodian communities in the U.S.
Below examine the 2020 AAPI population by Census Designated Places in Los Angeles County.


The “LA vs Hate” initiative
The “LA vs Hate” initiative was formed to address hate and hate crimes in Los Angeles County. It was launched in response to the increase in reports of hate in the county and the rise in anti-Asian sentiment in 2020.
The Los Angeles County Commission on Human Relations publishes hate crime data used in the visualization.
On the street
Los Angeles, California
Private residence
Los Angeles, California
Data Discrepancies
In these snapshots, data released by local jurisdictions, which are typically recorded by their own law enforcement agencies, are used. Although FBI hate crimes data are from local law enforcement data, the data reported by local governments often do not match those reported by the FBI. Sometimes the numbers reported by a city in its local data release are higher than the FBI hate crime data reported for the state in which the city is located. Sometimes, it takes the FBI a long time to update or correct their data, leading to outdated or misleading data. This could be due to a variety of factors and reasons, such as failure to report hate crimes or miscategorization of hate crimes.
For example, take a closer look at the following data discrepancies:
Local Reported Data
FBI Reported Data
* These values were provided for Asian and Pacific Islander combined
† Prior to October 30, 2023 update
These issues make the data unreliable which highlight the need for community trackers to fill in the gap. They provide lenses into anti-Asian hate incidents that negatively affect the community, including those that are not legally classified as hate crimes.